
1. What Is Brand Valuation, Really?
A brand rarely appears as a single line item on a balance sheet, yet it can quietly account for a significant share of a company’s total worth. Why? Because a brand is not just a name or a logo — it is a promise of quality, trust, and future earnings that customers are willing to pay a premium for.
Brand valuation translates recognition, loyalty, market positioning, and pricing power into a monetary value that companies, investors, regulators, and acquirers can rely upon. But how is this value determined, who performs it, and why do two companies with near-identical products often carry very different brand values? This guide breaks it down — from first principles through to the regulatory frameworks that make the exercise obligatory.
In one line: Brand valuation is the process of estimating the economic value of a brand as a distinct, identifiable intangible asset — separate from a company’s other assets and cash-generating operations.
It considers not only current sales, but also:
- Customer loyalty and repeat purchase behaviour
- Premium pricing power over unbranded or generic competitors
- Market positioning and geographic reach
- Brand strength, awareness, and future earning potential
In simple terms, brand valuation answers one core question: “If this brand were licensed, sold, or transferred today, what would it be worth, and why?”
Brand valuation is required across a wide range of scenarios — M&A and purchase price allocation, licensing and franchising arrangements, transfer pricing documentation, financial reporting under Ind AS/IFRS, litigation and dispute resolution, tax and regulatory filings, and internal strategic decision-making.
2. The Invisible Fortune — Why the Balance Sheet Hides Your Biggest Asset
There is a structural irony in the way modern accounting standards treat brands. The assets that carry the most commercial weight — the names that command price premiums, compress customer acquisition costs, and sustain market share through competitive cycles — are precisely the ones accounting standards refuse to let onto the balance sheet. The stronger the brand, the more invisible it is in the financial statements of the company that built it.
Ind AS 38 (Intangible Assets), which mirrors IAS 38, is unambiguous on this point: an internally generated brand shall not be recognised as an intangible asset. The standard does not dispute that brand value exists — it disputes the ability to reliably measure it. Expenditure on advertising, customer research, and market development cannot be reliably separated from expenditure that builds the business more generally, nor accumulated and pointed to as the cost of one specific, identifiable asset. The standard therefore takes a conservative position: if the cost cannot be reliably measured, it may not be capitalised.
The commercial consequence is significant. Consider the gap between the market capitalisation and the net book value of any large consumer or technology company. For a Hindustan Unilever, an Asian Paints, or a Titan, the gap between what the market says the equity is worth and what the balance sheet shows in net assets is enormous — and the overwhelming majority of that gap is attributable to intangible assets, of which the brand is typically the single largest component. None of it appears in the audited financial statements. It is real, but it is invisible.
The brand surfaces on the balance sheet only once — the moment the company that built it is acquired by someone else. At that point, what was invisible becomes obligatory to measure.
Under Ind AS 103 (Business Combinations), the accounting treatment reverses completely: the acquirer must recognise all identifiable assets acquired at fair value on the acquisition date, including intangible assets that were never on the acquiree’s own books. The acquiree’s internally generated brand — barred from capitalisation in its own hands — must now be measured at fair value and recognised separately from goodwill. The transaction makes measurement unavoidable.
|
This accounting asymmetry is the commercial context for virtually all brand valuation work. It is not an academic exercise — it is a required step in the audit of every acquisition involving a recognisable brand. The real question is not whether to value the brand, but whether the valuation is rigorous enough to survive the scrutiny of the acquirer’s auditors, the acquiree’s advisors, and, in some cases, the regulator. |
3. Where Does Brand Value Actually Come From?
Before selecting a valuation method, it is necessary to understand which economic mechanism is actually generating value for the specific brand under analysis. Different brands create value through fundamentally different channels, and the method selected should align with the dominant mechanism.
Price Premium
The most intuitive channel: a branded product commands a higher price than a functionally equivalent unbranded or generic alternative — a well-known toothpaste brand over the store-brand equivalent, a well-known hotel brand over a comparable independent property. The premium, multiplied by the volume of branded sales, represents the brand’s direct contribution to revenue. This mechanism is most tractable in consumer goods, retail, and hospitality, where branded and generic products coexist in observable markets.
Volume Premium
A strong brand generates higher volumes than a comparable unbranded offering at the same price point. Market share leadership is partly a brand effect — consumers prefer the known quantity — translating into economies of scale in procurement, manufacturing, and distribution that an unbranded competitor cannot match.
Customer Acquisition Cost Compression
A recognisable brand significantly lowers the cost of acquiring new customers — higher organic search volume, higher direct traffic, and better conversion on paid channels. The brand, in effect, performs part of the sales function that would otherwise require headcount and budget.
Customer Loyalty and Reduced Churn
Brand-loyal customers exhibit lower price sensitivity, higher repeat purchase rates, and greater resistance to competitive switching. In subscription or recurring-revenue models, this shows up as lower churn and higher lifetime value per customer.
Market Extension Value
A strong brand can be leveraged to enter adjacent product categories or new geographies at a fraction of the cost a new entrant would incur — a trusted consumer group launching a new product category, or a financial services brand entering a new line of business, each benefits from a consumer trust franchise that reduces launch risk and compresses time-to-scale. This option value is rarely captured explicitly in a DCF model but is real.
|
In practice, the dominant mechanism varies by sector. FMCG brands are primarily price-and-volume-premium businesses. Financial services brands are primarily trust-and-acquisition-cost businesses. Technology platform brands are primarily market-extension-and-ecosystem-lock-in businesses. A single valuation framework applied uniformly across all categories will produce correct numbers in some cases and misleading ones in others. |
4. Five Ways to Put a Number on a Brand
Five broad approaches are used to estimate brand value in practice. They are rarely used in isolation — a robust engagement typically anchors on one primary method and uses one or two others as a cross-check.
1. Relief-from-Royalty (RFR) Method
The most widely used and regulator-accepted approach in India. It estimates brand value based on the royalty a company is “relieved” from paying because it owns the brand rather than licensing it from a third party. Market-anchored, widely accepted by tax authorities, courts, and regulators, and it works even when the brand isn’t separately licensed, since it models a hypothetical arm’s-length arrangement. Section 6 below walks through the full mechanics.
2. Multi-Period Excess Earnings Method / Premium Profit Method
Values the brand based on the incremental profit it generates compared to an equivalent unbranded (generic) product or business — isolating the “premium” attributable specifically to the brand and discounting it over the brand’s useful life. Best suited where reliable data exists on branded versus unbranded pricing within the same category.
3. Market Approach (Comparable Transactions / Multiples)
Derives brand value using observable market transactions — brand sales, licensing deals, or royalty rates for comparable brands in the same or a similar industry. Requires a robust set of comparable, arm’s-length transactions and is most often used as a sanity check against RFR or income-approach outputs; standalone applicability in India is limited by the scarcity of publicly disclosed brand transaction data.
4. Cost Approach (Cost-to-Recreate / Historical Cost)
Estimates the cost required to rebuild the brand’s current level of awareness, reputation, and market position from zero — including marketing spend, advertising, and brand-building costs incurred historically or that would be incurred today. Useful for newer brands or as a valuation floor; it does not directly capture future earning potential, so it is rarely the primary method for established brands.
5. Brand Strength / Scorecard-Based Adjustment
Often layered on top of RFR — a brand strength score, based on factors like market leadership, geographic diversification, customer loyalty, and legal protection, is used to justify the royalty rate selected, or to adjust the discount rate applied. See Section 7 for a full treatment.
5. Inside the Engine Room — A Technical Walkthrough of Relief-from-Royalty
The Relief-from-Royalty (RFR) method is preferred by major valuation agencies, Big 4 transaction services teams, and most auditors reviewing PPA exercises. Its premise is simple: a company that owns its brand is relieved from paying a royalty to a third-party licensor for the right to use it. The brand’s value is the present value of the royalty payments it would otherwise have had to make over its useful life. The mechanics proceed through six steps, each carrying material judgement.
Step 1 — Identify Branded Revenue
The royalty is earned only on revenue attributable to the brand. In a single-brand, single-product business this is straightforward; in a diversified or multi-brand business it requires careful disaggregation. Revenue from unbranded contract manufacturing, raw-material trading, or private-label production should be excluded, and where a business operates under multiple brands, revenue must be assigned by brand with rigour — not proportionally by feel.
Step 2 — Determine the Royalty Rate
The single most consequential — and most contested — judgement in the model. The rate is benchmarked against comparable licensing transactions in the same industry, geography, and brand tier, drawn from databases such as RoyaltySource, ktMINE, and BVR’s RoyaltyPro. The raw output of a comparable search is a distribution of rates, not a point estimate; the valuer’s job is to locate the subject brand within that distribution based on its brand strength relative to the comparables.
|
Industry Sector |
Typical RFR Range |
Primary Driver |
Notes |
|
FMCG / Consumer Goods |
1.5% – 5.0% |
Price premium, volume |
Wider range for premium sub-segments (3–6%) |
|
Technology / Software |
2.0% – 5.5% |
Trust, market extension |
Brand vs. technology separation is a challenge in tech PPA |
|
Pharmaceuticals |
1.0% – 3.5% |
Trust, physician pull |
Brand separated from patent/know-how; often lowest component |
|
Luxury Goods |
5.0% – 15.0% |
Price premium (very high) |
Luxury brand premium is the product — rate can exceed 12% |
|
Retail / Fashion |
1.5% – 6.0% |
Traffic generation, loyalty |
Franchise arrangements provide good CUP comparables |
|
Financial Services |
0.5% – 2.0% |
Trust, acquisition cost |
Regulatory constraints limit observable licensing |
|
Hospitality |
2.0% – 5.5% |
Price premium, distribution |
Hotel management agreements provide strong CUP data |
|
Food & Beverages |
1.0% – 4.0% |
Volume, trade distribution |
Franchise bottler/distributor agreements are rich comparables |
|
Indicative ranges based on publicly available licensing transaction data, for illustrative purposes only. The actual rate for any specific engagement depends on the brand strength tier, royalty base definition, and exclusivity terms, and requires a database-sourced comparable analysis — this table is not a substitute for that analysis. |
Step 3 — Tax-Effect the Royalty Stream
Royalty savings are taxable income — a hypothetical licensee would deduct royalty payments in arriving at taxable profit, so the savings are earned on a post-tax basis: after-tax royalty saving = royalty rate × branded revenue × (1 − effective tax rate). Using pre-tax royalty savings overstates brand value and invites challenge from any experienced auditor.
Step 4 — Forecast Over Useful Life and Derive Terminal Value
After-tax royalty savings are projected over the brand’s useful life. For a perpetual brand, a terminal value is calculated using the Gordon Growth Model; for a finite-life brand, the projection period equals the useful life and no terminal value is added. Growth rates should be derived from the business’s own projections, tested against industry growth and historical CAGR.
Step 5 — Discount at the Appropriate Rate
The discount rate reflects the risk associated with the brand’s specific cash flows. The starting point is the enterprise WACC, adjusted where the brand’s cash flows are more or less risky than the enterprise as a whole — a highly diversified brand across geographies and segments typically warrants a modest downward adjustment (commonly 50–150 bps), applied consistently with the assumptions used elsewhere in the financial model.
Step 6 — Tax Amortisation Benefit (TAB)
Frequently omitted by practitioners unfamiliar with intangible asset valuation, and its omission materially understates fair value. In an acquisition, the acquirer can amortise the acquired brand for tax purposes over its useful life — under Section 32 of the Income Tax Act, 1961, acquired intangibles including business or commercial rights are eligible for depreciation at 25% on written-down value. This generates a future tax shield that increases the intangible’s fair value relative to a scenario with no amortisation benefit.
|
Tax Amortisation Benefit — Illustrative Worked Example (Hypothetical) TAB Factor = 1 ÷ [1 − (t ÷ n) ÷ (WACC + 1/n)], where t = effective tax rate, n = useful life in years, WACC = discount rate. For an illustrative pre-TAB brand value of ₹100 Cr, a 10-year useful life, a 14% WACC, and a 25.17% effective tax rate: TAB Factor ≈ 1.095, giving a post-TAB value of approximately ₹109.5 Cr — a ~9.5% uplift that is material in any mid-market transaction. Figures are hypothetical and for illustration only. |
Multi-Period Excess Earnings Method (MEEM) — A Closer Look
MEEM derives the brand’s value by modelling its direct contribution to earnings — isolating what the brand earns after deducting returns attributable to all other assets contributing to the same earnings stream. The technique begins with total operating earnings of the branded business unit and deducts Contributory Asset Charges (CACs): a working-capital charge (typically cost of debt), a fixed-asset charge (WACC or an asset-specific rate on net book value), an assembled-workforce charge (recruitment and training cost, capitalised), and, where relevant, a technology/IP charge. The residual earnings stream after all CACs represents the brand’s contribution, discounted over its useful life.
MEEM is theoretically superior to RFR in that it directly measures what the brand earns rather than benchmarking against what a third party might pay, but it is more demanding in practice — it requires a clean separation of the business unit’s financials and a Weighted Average Return on Assets (WARA) reconciliation confirming that the sum of returns across all identified intangibles equals the transaction IRR. When the WARA reconciliation closes, it provides powerful internal validation; when it does not, it signals that the intangible-class allocation is internally inconsistent and will not survive audit scrutiny (see Section 10).
6. Scoring Strength — Turning Perception into a Royalty Rate
The Brand Strength Score (BSS) is the bridge between the quantitative model and the qualitative reality of a brand’s market position. Its purpose is to locate the subject brand within the distribution of royalty rates for its sector — not at the median, but at the position that reflects its actual competitive standing relative to the comparable transactions.
Interbrand’s Framework
Interbrand’s annual Best Global Brands methodology embeds a ten-factor brand strength model used to determine the brand’s risk profile and thereby derive a brand-specific discount rate and terminal value multiplier. The ten factors group into three categories: Internal Factors (clarity of brand strategy, leadership commitment, governance and brand management, responsiveness to market signals), External Factors (authenticity of the brand story, relevance to consumer needs, differentiation from competitive alternatives, consistency across touchpoints), and Financial Factors (brand presence in its sector, consumer engagement measured through NPS or equivalent). The aggregate score, out of 100, maps to a position in the royalty rate range for the category.
Brand Finance’s Brand Strength Index (BSI)
Brand Finance publishes a Brand Strength Index on a 0–100 scale mapping to a letter grade from D to AAA+ — analogous to a credit rating — developed from three equally weighted pillars: Stakeholder Equity (awareness, consideration, preference, recommendation), Business Performance (market share, growth, margins), and Brand Investment (marketing spend, distribution, innovation pipeline). A brand rated AAA+ is assigned a royalty rate at the upper end of its sector range; a brand rated B or below is assigned a rate near the floor.
Building an Engagement-Specific BSS
For an engagement-specific BSS, the valuer constructs a scoring framework calibrated to the brand’s sector and competitive context, typically covering: trademark protection and legal robustness, consumer awareness and recall (aided versus unaided), market share trend over three to five years, price premium versus category average, geographic penetration, channel breadth, brand age and heritage, and management’s investment commitment. Each dimension is scored using market research data, management inputs, and public information; the aggregate is mapped to a position within the applicable royalty rate range. The framework and its inputs must be documented in sufficient detail to withstand cross-examination by an auditor or a transfer pricing officer.
Benchmarking Reality — What the Market Approach Actually Tells Us
The market approach to brand valuation rarely produces a standalone conclusion in Indian engagements — the M&A disclosure environment is too sparse, and licensing transaction data too heterogeneous, to anchor a final conclusion on its own. Its primary role is as a calibration tool: does the royalty rate or MEEM-derived value make sense relative to what the market actually transacts?
● RoyaltySource — one of the most comprehensive databases, with 20,000+ licensing agreements, searchable by SIC code, licensor, geography, and royalty base; particularly strong in technology and pharmaceuticals.
● ktMINE — emphasises transfer pricing-ready comparables, with strong documentation of royalty base definitions critical for CUP analysis.
● BVR RoyaltyPro — aggregates publicly reported licensing data from SEC filings, court documents, and academic studies, useful for cross-referencing.
● Indian FEMA data — royalty payments to foreign collaborators reported in RBI annual surveys and FEMA approvals provide an India-specific pricing anchor, though disclosure detail is limited.
The challenge is not data volume but comparability — selection criteria must be rigorous on industry segment, brand tier, royalty base definition (net sales versus gross sales is a material distinction), and geographic scope. Where brand values have been disclosed in acquisition transactions, typically as part of a PPA note in the acquirer’s financial statements, the implied brand value as a multiple of revenue or EBITDA provides a market reference point — a useful reasonableness check rather than a primary methodology, given the small and heterogeneous Indian dataset.
7. How Long Does a Brand Live? — The Useful Life Question
The useful life assumption profoundly affects both the brand value and the post-acquisition P&L treatment, yet it receives substantially less analytical attention than the royalty rate or discount rate — perhaps because it involves judgements that are harder to anchor in observable data.
The Ind AS 38 Framework
Ind AS 38 does not prescribe a maximum useful life for intangible assets, but it does require that useful life be assessed as either finite (with a specific amortisation period) or indefinite (with annual impairment testing rather than amortisation). An entity asserting an indefinite useful life must demonstrate there is no foreseeable limit to the period over which the asset is expected to generate net cash inflows, considering:
- The expected usage pattern and typical product lifecycle in the sector
- Technical, technological, or commercial obsolescence risk
- Legal constraints, including trademark renewal terms and any contractual limits on licensed use
- The entity’s track record and ability to continue investing in the brand
- The stability of the industry in which the brand operates
Asserting an indefinite useful life is not inherently conservative — it shifts the risk from amortisation (a predictable, income-statement charge) to impairment (a potentially concentrated, event-driven charge that can be significantly larger). An acquirer that assigns an indefinite life to a brand in a sector undergoing rapid technological disruption takes on impairment risk that auditors and investors may not have fully priced in.
Sector Useful Life Observations
● FMCG / staple consumer brands: indefinite life is defensible for established national brands with multi-decade presence and consistent investment; sub-categories exposed to health-trend shifts warrant a more cautious 15–25-year finite stance.
● Technology sector brands: typically finite, 7–15 years, given rapid product-lifecycle evolution and platform shifts.
● Pharmaceutical / OTC brands: OTC consumer brands with broad awareness may qualify for indefinite lives; prescription brand names tied to specific compounds typically warrant finite lives of 10–20 years given post-patent generic competition.
● Financial services brands: generally long-lived, with large bank and insurance brands typically asserting indefinite lives; fintech and digital-first assertions of indefinite life face increasing scrutiny.
● Luxury brands: among the most defensible for indefinite life — heritage and scarcity are intrinsic to the category economics.
|
The legal life of a trademark — the 10-year renewable registration period under the Trade Marks Act, 1999 — should not be confused with economic useful life. Registrations are renewed as a matter of course; the economic question is how long the brand’s consumer relevance and premium will persist. Legal life is the floor; economic life is the judgement call. |
8. The Rulebook — Where Indian Law Makes Brand Valuation Mandatory
Brand valuation in India is not governed by a single statute — it sits at the intersection of multiple regulatory regimes, each with its own trigger event, standard of value, and institutional enforcer. Understanding which regime applies, and precisely what it requires, is essential to designing an engagement that will survive scrutiny.
FEMA and RBI — Cross-Border Royalty Arrangements
The Foreign Exchange Management Act, 1999 and the associated RBI regulations govern outward royalty payments by Indian companies to foreign licensors. Under the current position, most royalty payments to foreign brand licensors proceed under the Automatic Route without a cap, but they remain reportable transactions requiring appropriate documentation and must be at arm’s length. Where the royalty rate or the overall arrangement raises arm’s-length concerns — particularly for related-party transactions subject to transfer pricing review — regulators will examine whether the economic substance of the licensing arrangement is real and the rate consistent with what an independent party would negotiate. A brand valuation underpinned by a documented comparable analysis is the most defensible basis for the rate applied.
Transfer Pricing Under Section 92 of the Income Tax Act
Section 92 requires that all international transactions between associated enterprises be conducted at arm’s length. Brand royalty arrangements between an Indian entity and its foreign affiliate are among the most frequently scrutinised transfer pricing items. The Transfer Pricing Officer applies either the Comparable Uncontrolled Price (CUP) method, benchmarking the royalty rate directly against comparable third-party transactions, or the Transactional Net Margin Method (TNMM) as an alternative. The burden of proof lies with the taxpayer to demonstrate that the rate is arm’s length; a brand valuation report with a documented comparable royalty analysis substantially strengthens the taxpayer’s position and converts a potential dispute into a documented, methodologically grounded filing. Contemporaneous documentation requirements under Rule 10D effectively require the valuation exercise to be completed before the return is filed, not after an audit notice is received.
SEBI LODR Regulations — Related-Party Brand Transactions for Listed Entities
For listed companies, brand licensing arrangements with related parties — most commonly a listed operating entity licensing a brand from or to a promoter-group holding company — attract SEBI’s Related Party Transaction framework under Regulation 23 of the LODR Regulations. Transactions exceeding the prescribed materiality thresholds require prior Audit Committee approval and, above higher thresholds, shareholder approval where the related party cannot vote. The Audit Committee’s approval must be on arm’s-length terms, which in practice requires a fair value opinion from an independent party.
IBC — Brand Valuation in Insolvency and Resolution
Under the Insolvency and Bankruptcy Code, 2016, the Resolution Professional is required to conduct a fair valuation and a liquidation value assessment of all assets of the Corporate Debtor under the CIRP Regulations, including intangible assets such as brands. These valuations must be conducted by Registered Valuers registered with the IBBI under the Companies (Registered Valuers and Valuation) Rules, 2017. The distressed business context often makes going-concern income-based projections difficult to sustain, while the liquidation value of an intangible asset may bear little resemblance to its going-concern value — the IBBI requires both, and the divergence for an intangible-heavy business can be substantial and must be clearly explained.
Companies Act Section 247 and the Registered Valuer Credential
For any valuation required under the Companies Act, 2013 — including a valuation of shares or intangible assets for a scheme of arrangement, amalgamation, merger, or demerger under Sections 230–232 — the valuation must be conducted by a Registered Valuer under Section 247 read with the Companies (Registered Valuers and Valuation) Rules, 2017. The rules designate separate asset classes, including, critically, Intangible Assets (which covers brands, trademarks, customer relationships, and similar items). Only a Registered Valuer registered for the Intangible Assets class may conduct a valuation for Companies Act purposes in this category — a report from a well-credentialed but unregistered practitioner will not be accepted by the NCLT or the Registrar of Companies, regardless of its methodological quality.
9. One Size Never Fits All — Sector-by-Sector Realities
Standard brand valuation methodology is designed to be sector-agnostic. In practice, each sector introduces specific complications that a generic framework handles poorly.
FMCG and Consumer Goods
The FMCG sector is where the income approach is most tractable — branded and generic alternatives coexist in visible markets, distribution structures are well documented, and licensing transaction data is relatively abundant. The primary complexity is brand architecture: most large FMCG businesses operate portfolios of sub-brands under a master brand. The question of whether to value the master brand, the sub-brand, or both — and how to avoid double-counting — requires a clear brand architecture analysis before the valuation framework is built.
Technology and Software
The fundamental challenge in technology PPA is separating brand value from technology value — in a software product company, customers buy the product partly because they trust the brand and partly because the technology delivers the outcome. The standard approach is to value technology using MEEM or RFR on technology revenues, then derive the brand value residually, or vice versa; the risk is that the interaction between the two assets creates circular dependencies that can only be resolved by clearly defining which asset is valued first and how the revenue base is split.
Pharmaceuticals
Pharmaceutical intangibles typically comprise three layers: the patent or data exclusivity on the active compound, the associated manufacturing know-how, and the brand (particularly for OTC products). In prescription contexts, the “brand” physicians prescribe is often inseparable from the product’s clinical evidence base — for Rx drugs, brand value as classically defined is modest, with the patent and clinical data the primary value drivers. For OTC products with broad consumer advertising, the brand can be the primary intangible.
Financial Services
Brand valuation in financial services faces two specific complications. First, observable brand licensing transactions between financial services entities are rare, so the RFR comparable base is thin. Second, regulatory constraints limit the contexts in which financial services brands can be monetised — a bank brand worth a large sum on a going-concern income basis may have a much lower realisation value in a stressed scenario, because regulators may block a brand transfer that would otherwise be commercially logical.
B2B Services Brands
B2B service brands — law firms, consulting practices, engineering service companies — present the hardest valuation challenge. Brand value in these businesses is largely co-terminous with the reputation of individual key practitioners and client relationships built over time; the brand name per se has limited standalone transferability. A significant portion of what appears to be “brand value” in a B2B services firm is actually customer relationship value or assembled workforce value — overattributing to brand and underattributing to customer relationships is a common error.
10. Managing a House of Brands — Portfolio Valuation Challenges
Most valuation practitioners encounter brand valuation in the context of a single brand — but many of the most commercially interesting situations involve businesses operating portfolios of brands at different levels of a brand architecture hierarchy. Valuing a brand portfolio introduces complications that go beyond repeating the single-brand exercise multiple times.
The Master Brand Halo Effect
In an endorsed brand architecture, where sub-brands trade partly on the equity of a master brand, there is a risk of double-counting if both the master brand and the sub-brand are valued without accounting for their interaction — the sub-brand’s revenue premium partially reflects the halo of the master brand. Attributing the full premium to the sub-brand and then separately valuing the master brand on its own revenue base results in the same brand equity being captured twice. The appropriate approach involves a brand contribution analysis that explicitly allocates the halo between master and sub-brand before applying royalty rates.
Brand Rationalisation
Portfolio valuation is an input to brand rationalisation decisions — identifying which brands justify continued investment and which should be retired, consolidated under stronger brands, or sold. A brand that generates revenue but contributes negative economic value after the full cost of maintaining it (marketing investment, dedicated distribution, separate packaging) should be a rationalisation candidate. The valuation output, properly segmented by brand, makes this analysis possible in a way that consolidated financial reporting does not.
Brand and Customer Relationship, Across a Portfolio
In portfolio contexts, it is common to find that the brand drives acquisition for some customers while the relationship drives retention for others — and that these two segments are best served by different brands in the portfolio. Disaggregating the economics by brand and by customer segment simultaneously is analytically demanding but produces a more commercially useful output than a single portfolio-level brand value number.
11. Ten Brands, Ten Billion-Dollar Stories — Global & Indian Leaderboard
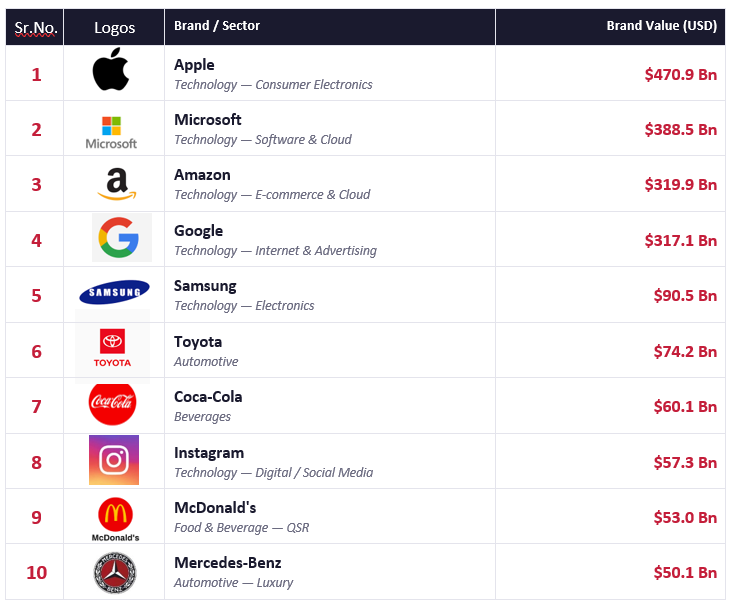
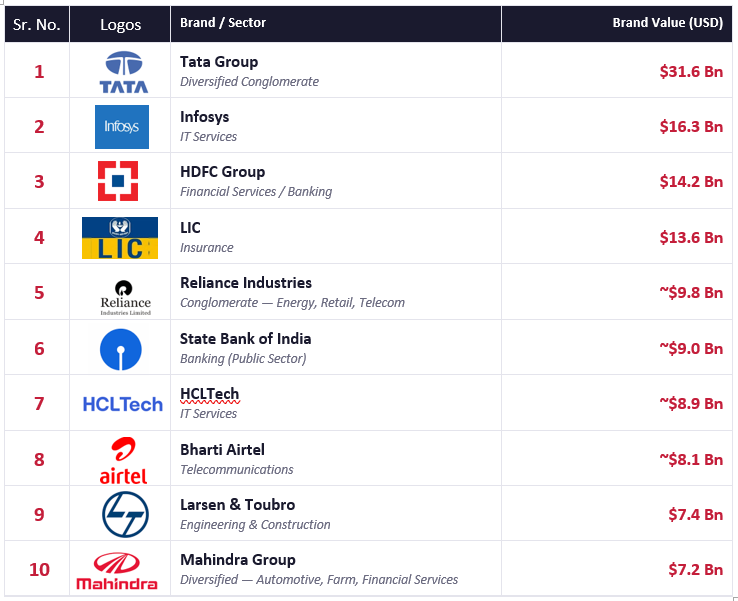
To ground the methodology discussed above in real numbers, this section presents the ten most valuable brands globally and the ten most valuable Indian brands, as ranked by leading independent brand valuation agencies. These figures are third-party published rankings, shown here for illustrative and educational reference — they do not represent valuations performed by Corporate Valuations, and are not to be relied upon for any transaction, financial reporting, or regulatory purpose.
Global Top 10 — Interbrand Best Global Brands, 2025
|
Source: Interbrand, Best Global Brands 2025 (published October 2025). Brand values reflect Interbrand’s proprietary methodology combining financial performance, the role of brand in purchase decisions, and brand strength. A first for the ranking this year: Instagram became the first social-media platform to enter the global Top 10. |
Indian Top 10 — Brand Finance India 100, 2025
|
Source: Brand Finance, India 100, 2025 report (published June 2025). Tata Group became the first Indian brand to cross the USD 30 billion mark. Values for brands ranked 5–10 are approximate, as reported in secondary market coverage of the underlying Brand Finance data; readers requiring precise, current figures should refer to the Brand Finance India 100 report directly. The India 100 list’s combined brand value stood at USD 236.5 billion in 2025. |
12. The Final Word — Why Brand Valuation Is More Than a Number
Brand valuation, done well, is among the more intellectually demanding exercises in intangible asset practice. It requires command of empirical licensing data, facility with multi-period financial modelling, an understanding of consumer behaviour economics, deep familiarity with the regulatory frameworks that govern the output’s use, and the judgement to navigate the interaction between a strong analytical framework and the irreducibly qualitative reality of how brands actually generate value.
Digital and platform brands — brands whose primary equity resides not in consumer product recognition but in network effects and platform dependencies — are challenging the RFR method’s assumption that branded revenue is a well-defined quantity. When the brand and the platform are the same thing, the question of what royalty rate a licensee would pay for the brand alone is almost unanswerable. New frameworks assessing brand contribution through user-acquisition-cost differentials and organic growth share of traffic are emerging, but are not yet standardised.
Influencer and creator brands present a different challenge — very high consumer recognition and genuine premium-generating capability, but deeply uncertain transferability, the separability criterion central to Ind AS 38. A brand that exists because of the individual identity of its founder is more vulnerable to key-person departure than any financial model typically captures.
AI-assisted brand tracking tools — continuous monitoring of brand sentiment, share of search, Net Promoter Score, and price realisation data at a granularity not previously available — are beginning to provide a richer empirical basis for the qualitative inputs to brand strength scoring. As this data matures, the BSS component of brand valuation should become more objectively anchored and less subject to the assessor-dependent variability that currently makes it one of the softer elements of an otherwise quantitative model.
|
The discipline of brand valuation is not about producing a number. It is about constructing a rigorous, evidence-based argument for why one number is more credible than another — an argument that will survive the scrutiny of an auditor, a transfer pricing officer, or a court. |
For practitioners, the standard of work expected continues to rise as Indian financial reporting practice matures, as NCLT jurisprudence on intangible asset values in IBC proceedings develops, and as transfer pricing enforcement on royalty arrangements intensifies. The era in which a brand valuation report was a relatively informal exercise producing a number that mostly went unexamined is clearly over. The discipline is being asked to demonstrate the same rigour long expected of DCF-based equity valuations — and the methodology, properly applied, is more than capable of meeting that standard.
When companies treat brand valuation as a rigorous, methodology-driven exercise rather than a marketing formality, it becomes a powerful tool for M&A negotiations, tax compliance, financial reporting accuracy, and long-term brand investment decisions. In the long run, brand valuation does not create brand value — strong customer relationships and consistent execution do. Valuation simply measures it.