
1. What Is Non-Cash Working Capital?
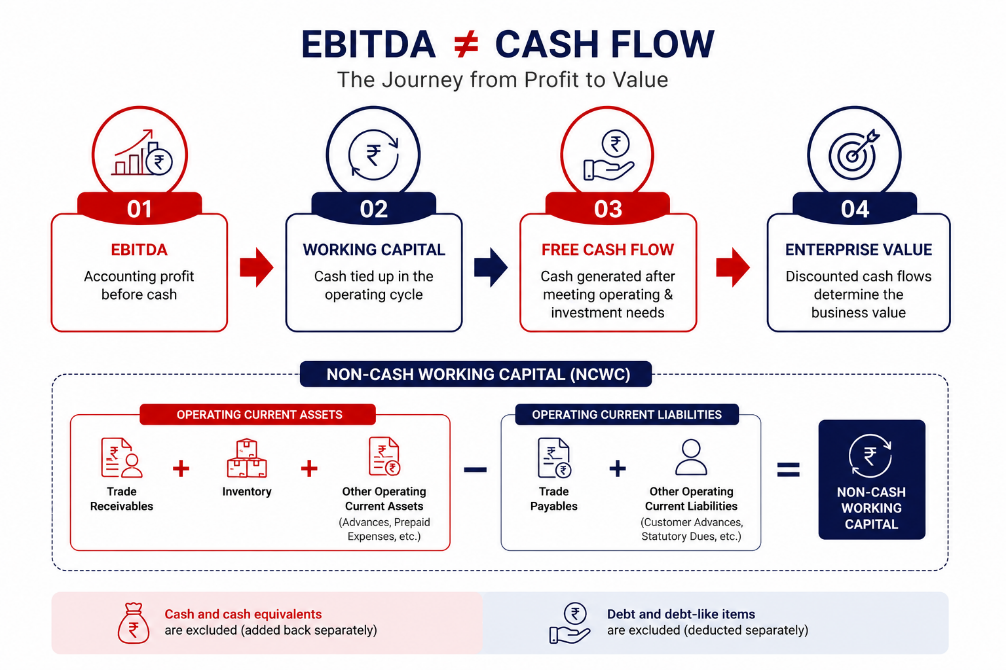
Working capital, in its accounting sense, is current assets minus current liabilities. But for valuation purposes, we strip out two items that are not “operating” in nature: cash and cash equivalents, and debt (or debt-like items).
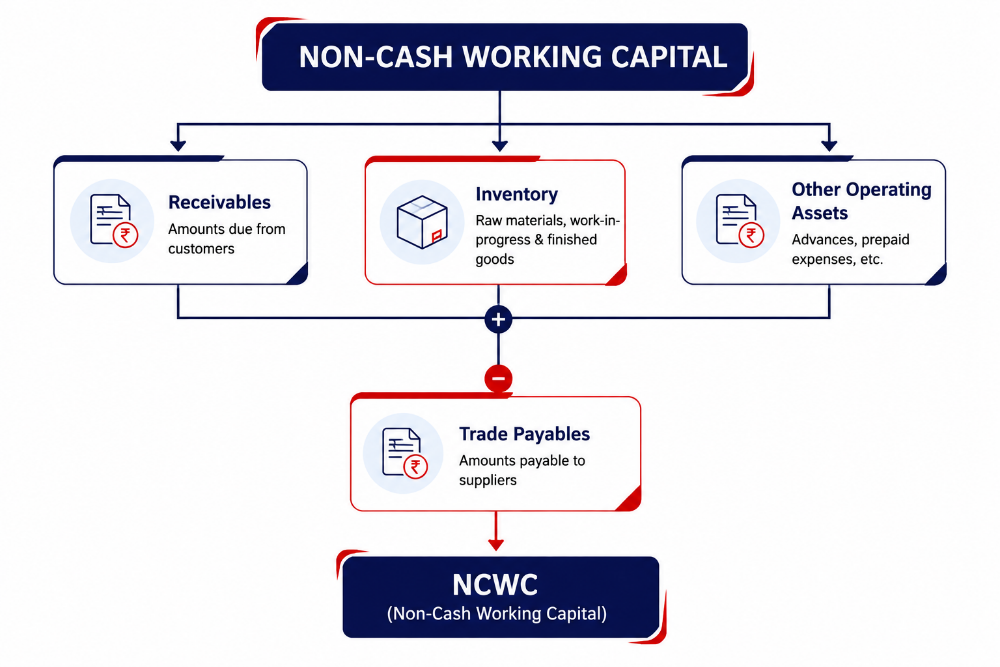
What remains is non-cash working capital — the capital tied up in the operating cycle of the business:
- Trade receivables
- Inventory
- Other operating current assets (advances to suppliers, prepaid operating expenses)
- Less: Trade payables and other operating current liabilities (customer advances, statutory dues that are operating in nature)
NCWC represents the cash a business needs to fund its day-to-day operations — buying raw materials, holding stock, extending credit to customers — before it collects cash from sales.
1.1 Why Cash and Debt Are Excluded
Cash and debt are financing items, not operating items. Including them in working capital would double-count value that is already captured elsewhere in the valuation — cash is added back as a separate asset, and debt is deducted separately to arrive at equity value. Mixing them into working capital distorts the free cash flow calculation and can lead to circular or inflated valuations.
This is why every well-built DCF model isolates non-cash working capital as a distinct, purely operating metric.
2. Non-Cash Working Capital in DCF Valuation
In a discounted cash flow model, free cash flow is derived as:
Free Cash Flow = EBIT(1-tax) + Depreciation − Capex − Increase in Non-Cash Working Capital
Notice the last term. If a business is growing revenue, it typically needs more receivables and more inventory to support that growth — this is an increase in NCWC, and it is a cash outflow, even though it never appears in the profit and loss account.
This is precisely why a company can report rising EBITDA year after year and still generate little or negative free cash flow. The profit exists on paper; the cash is stuck in debtors’ ledgers and warehouse shelves.
2.1 Growth, Working Capital, and Reinvestment Requirement
Growth is not free. Every additional rupee of revenue usually demands additional working capital investment, in the same way it demands capex. A valuer projecting high growth rates must correspondingly project a rising working capital requirement — failing to do so silently overstates free cash flow and, therefore, valuation.
A useful discipline is to model NCWC as a percentage of revenue (based on historical trends and industry benchmarks) and apply that ratio consistently across the projection period, rather than assuming working capital stays flat while revenue grows.
3. Operating vs Non-Operating Working Capital
Not every current asset or liability on the balance sheet belongs in the NCWC calculation. A valuer must separate:
• Operating items — directly linked to the core business cycle (trade receivables, trade payables, raw material and finished goods inventory, customer advances tied to delivery obligations).
• Non-operating items — incidental or one-off in nature (loans to related parties parked as “other receivables,” investments in current asset form, disputed claims, one-time deposits).
Including non-operating items in working capital either overstates the cash requirement of the business or understates its true operating efficiency. This distinction is easy to state but requires real diligence to apply, especially with related-party balances and miscellaneous “other” line items that companies often bundle together.
3.1 Normalised Working Capital vs Reported Working Capital
Reported working capital, as it appears in the audited financials, may reflect one-off distortions — a large year-end collection, a delayed payment to a supplier, an unusually high inventory build-up ahead of a festive season. A valuer should normalise these to arrive at a working capital level that reflects the business’s sustainable operating requirement.
This is comparable to normalising EBITDA for one-off items — except that working capital normalisation is far less commonly practised, and far more commonly overlooked.
4. Why EBITDA Is Not Cash Flow
Ask any promoter how their business is doing, and the answer usually starts with EBITDA. It is the number that shows up in board decks, bank covenants, and valuation conversations. But EBITDA has a well-known blind spot: it says nothing about how much cash is actually sitting locked up inside the business.
Two companies can report identical EBITDA and deserve very different valuations. The difference often lies not in the income statement, but in the balance sheet — specifically, in how efficiently the company manages its receivables, inventory, and payables. This is the domain of non-cash working capital (NCWC), and it is one of the most under-analysed drivers of value in Indian valuation practice.
This article lays out why non-cash working capital deserves far more attention than it typically gets — in DCF models, in transaction advisory, and in day-to-day valuation judgment.
5. The Working Capital Trap: When EBITDA Does Not Convert Into Value
This issue is especially relevant for B2B companies, manufacturers, EPC contractors, government contractors, pharma distributors, trading businesses, exporters, real estate-linked businesses, and high-growth startups — in short, any business with a long collection cycle.
High EBITDA does not always mean high value. A business with poor receivable discipline may show strong profits while generating weak free cash flow.
Illustration:
Company A and Company B both report EBITDA of ₹10 crore.
- Company A collects its receivables in 30 days.
- Company B collects its receivables in 150 days.
Company B may deserve a lower valuation multiple, because its profits are effectively locked up in receivables, and it needs meaningfully more capital to fund the same level of growth. This is the working capital trap — earnings that look identical on the P&L but carry very different cash-generating quality.
Key insight: Working capital efficiency changes the quality of earnings, and quality of earnings directly influences the valuation multiple a business deserves.
6. Receivables: Revenue Quality and Cash Conversion
Receivables are not merely an asset on the balance sheet — they represent revenue that has not yet converted into cash, and revenue that may never fully convert if collection risk is high.
A thorough analysis should cover:
- Debtor ageing profile
- Bad debt risk and historical write-off patterns
- Customer concentration risk
- Related-party receivables
- Government receivables (often slow-moving and susceptible to disputes)
- Disputed or litigated receivables
- Unbilled revenue
- Retention money held back by customers
- Credit period sanctioned vs actual collection period achieved
Valuation impact: Higher receivable days reduce free cash flow and may justify a higher working capital requirement in the model, or a specific adjustment for expected bad debt.
7. Inventory: Stock Risk and Valuation Leakage
Inventory analysis is critical for manufacturing, trading, pharma, retail, and consumer businesses, where stock can represent a large share of the balance sheet.
Points to examine:
- Composition — raw material, work-in-progress, finished goods
- Slow-moving and obsolete inventory
- Commodity price exposure and the risk of inventory devaluation
- Inventory holding period trends
- Inventory valuation policy (FIFO, weighted average, etc.)
- History of stock write-downs
- Signs of channel stuffing (pushing inventory to distributors to inflate reported sales)
- Seasonal build-up patterns
Valuation impact: Excess or obsolete inventory may be effectively non-operating, or overvalued on the books. It should not be assumed to support valuation at full book value.
8. Payables: Operating Credit or Hidden Stress?
Payables reduce the working capital a business needs to fund — but abnormally stretched payables can be a red flag rather than a sign of efficiency.
Areas to examine:
- Normal, contractual supplier credit terms
- Overdue creditors beyond agreed terms
- Disputed payables
- Related-party payables
- Statutory dues (GST, TDS, PF, ESI, etc.)
- Employee dues
- Capex-related creditors vs operating creditors (these should not be mixed)
Valuation impact: If payables are abnormally stretched relative to industry norms, the company may appear working-capital efficient on paper, but this may not be sustainable once suppliers tighten terms. A valuer should normalise stretched payables rather than take them at face value.
9. Customer Advances and Negative Working Capital Businesses
This is one of the more nuanced items in NCWC analysis. Customer advances reduce (or even reverse) the working capital requirement of a business. Some business models are structurally negative working capital businesses, because customers pay before delivery.
Common examples include SaaS subscriptions, travel bookings, education businesses, event businesses, e-commerce marketplaces, construction contracts with milestone billing, and consumer brands that collect distributor advances.
However, a valuer must probe further and ask whether the advances are:
- Recurring operating advances that will continue indefinitely as the business scales, or
- One-off or seasonal advances, or
- Advances linked to specific future delivery obligations (and therefore a liability the business must still fulfil)
Valuation insight: Negative working capital adds genuine value only when it is structural and sustainable — not when it is a temporary or one-off feature of the business.
10. Statutory Dues and GST Balances
This is an item often missed in working capital analysis. GST receivable, input tax credit, TDS receivable, advance tax, tax provisions, and other statutory liabilities should not be blindly bundled into operating working capital.
Some of these balances are genuinely operating in nature; others are tax-related, one-off, or subject to long recovery timelines. Getting this classification right requires judgment, not a mechanical rule.
11. Working Capital Days and the Cash Conversion Cycle
Rather than looking only at absolute rupee working capital, a more insightful approach is to convert each component into “days,” which allows comparison across companies of different sizes and across time periods.
Receivable Days = Trade Receivables ÷ Revenue × 365
Inventory Days = Inventory ÷ Cost of Goods Sold × 365
Payable Days = Trade Payables ÷ Purchases (or COGS) × 365
Cash Conversion Cycle = Receivable Days + Inventory Days − Payable Days
The cash conversion cycle (CCC) tells you how long cash remains locked inside the business before it comes back out as collections. A business with a 120-day cash conversion cycle needs substantially more capital to fund the same level of growth than a business with a 20-day cycle — and that difference should be reflected in both the working capital projection and, ultimately, the valuation.
12. Working Capital in Terminal Value
Terminal value often accounts for the largest share of a DCF valuation, and working capital assumptions carry through into it directly. In the terminal year, NCWC is typically assumed to grow in line with the long-term growth rate of revenue, maintaining a steady percentage-of-revenue relationship.
Getting the terminal-year NCWC-to-revenue ratio wrong — for example, by carrying forward an artificially low or normalised working capital base that isn’t realistic in perpetuity — can materially distort terminal value and, by extension, the overall valuation conclusion.
13. Working Capital in Transaction Advisory and Purchase Price Adjustment
Non-cash working capital is not just a DCF modelling input — it is a central negotiating point in M&A transactions. Most share purchase agreements include a working capital adjustment mechanism, where the final purchase price is adjusted based on the target’s working capital at closing relative to an agreed “normal” or “target” working capital level (often based on average historical working capital).
This is where all the diligence points discussed above — debtor quality, inventory obsolescence, payable sustainability, treatment of advances — translate directly into money changing hands. A buyer who fails to scrutinise NCWC quality at diligence stage can end up overpaying, or inheriting collection and inventory risk that was never priced into the deal.
14. Practical Case Study
Consider two mid-sized manufacturing companies, both reporting EBITDA of ₹15 crore on revenue of ₹100 crore.
|
Metric |
Company X |
Company Y |
|
Receivable Days |
45 |
110 |
|
Inventory Days |
30 |
75 (incl. slow-moving stock) |
|
Payable Days |
40 |
30 |
|
Cash Conversion Cycle |
~35 days |
~155 days |
On the surface, both look like comparable businesses with identical profitability. But Company Y needs vastly more working capital to sustain the same revenue and growth trajectory, its debtors carry higher collection risk, and a portion of its inventory may need to be written down rather than valued at book.
A valuer applying the same multiple to both companies would be materially mispricing Company Y. The correct approach is to build the difference into the free cash flow projections directly (through a higher working capital investment assumption) and, where inventory or receivable quality is genuinely impaired, apply a specific adjustment rather than relying on the multiple alone to capture the risk.
15. Conclusion: Value Belongs to Cash Flows, Not Accounting Profits
EBITDA is a useful starting point, but it is not the destination. The real test of a business’s quality is whether its profits convert into cash — and non-cash working capital is where that conversion either happens smoothly or gets stuck.
Non-cash working capital is not merely a mechanical adjustment line in a DCF model. It is a test of the company’s ability to convert growth into cash. A valuer must therefore analyse not just the amount of working capital tied up in a business, but its quality, sustainability, operating nature, and relevance in a transaction context.
Get this analysis right, and the valuation reflects economic reality. Get it wrong, and even the most carefully built DCF model will value accounting profits — not the cash flows that actually create value.